Introduction and Data preparation
Please follow the folloing links regarding data preparation and previous posts to follow along -
For Data Preparation - Part 0 - Plotting Using Seaborn - Data Preparation
For Part 1 - Part 1 - Plotting Using Seaborn - Violin, Box and Line Plot
For Part 2 - Part 2 - Plotting Using Seaborn - Distribution Plot, Facet Grid
For Part 3 - Part 3 - Plotting Using Seaborn - Donut
For Part 4 - Part 4 - Plotting Using Seaborn - Heatmap, Lollipop Plot, Scatter Plot
Distribution of score (percentage) across participants in various categories
test_scores_Participant = test_scores.groupby(['Participant identifier','Track','Designation']).agg({'Test Name':'size', 'Score':'sum', 'maximum_score':'sum'}).reset_index()
test_scores_Participant['Percent'] =round(test_scores_Participant['Score']/test_scores_Participant['maximum_score'],2)*100

Participant_1 = test_scores_Participant[test_scores_Participant['Test Name']==1].sort_values(by=['Percent','Test Name'],
ascending=False)

Participant_2TO5 = test_scores_Participant[test_scores_Participant['Test Name'].isin([2,3,4,5])].sort_values(by=['Percent','Test Name'],ascending=False)

Participant_6TO10 =  test_scores_Participant[test_scores_Participant['Test Name'].isin([6,7,8,9,10])].sort_values(by=['Percent','Test Name'],ascending=False)

Participant_10To16 = test_scores_Participant[test_scores_Participant['Test Name'].isin([11,12,13,14,15,16])].sort_values(by=['Percent','Test Name'],ascending=False)

Participant_17 = test_scores_Participant[test_scores_Participant['Test Name']==17].sort_values(by=['Percent','Test Name'],
ascending=False)

fig, ax = plt.subplots(figsize=(15,8))
sns.distplot(Participant_1['Percent'], label="Only 1 test", hist =False, kde = True, color = "#1abc9c")
sns.distplot(Participant_2TO5['Percent'], label="2 to 5", hist = False, kde = True, color = "#3498db")
sns.distplot(Participant_6TO10['Percent'], label="6 to 7", hist = False, kde = True,  color = "#e74c3c")
sns.distplot(Participant_10To16['Percent'], label="10 to 16", hist = False, kde = True, color = "#f39c12")
ax = sns.distplot(Participant_17['Percent'], label="All 17 test", hist = False, kde = True, color = "#95a5a6")
plt.legend(fontsize = 20)
plt.ylabel(ylabel = "Probablity Density", fontsize=25)
plt.xticks(fontsize = 15)
plt.yticks(fontsize = 15)
plt.xlabel(xlabel=  "Score %", fontsize=25)
fig.suptitle('Kernel density estimate of distribution of score (percentage)', fontsize=20, x = 0.5, y = 0.95)
#plb.savefig('KDE Plot.png',dpi=100,bbox_inches='tight')

fig, ax = plt.subplots(figsize=(15,8))

sns.distplot(Participant_1['Percent'], label="Only 1 test", kde =False, hist = True, color = "#1abc9c", hist_kws=dict(alpha=0.8))
sns.distplot(Participant_2TO5['Percent'], label="2 to 5 tests", kde = False, hist = True, color = "#3498db", hist_kws=dict(alpha=0.8))
sns.distplot(Participant_6TO10['Percent'], label="6 to 10 tests", kde = False, hist = True,  color = "#e74c3c", hist_kws=dict(alpha=0.8))
sns.distplot(Participant_10To16['Percent'], label="11 to 16 tests", kde = False, hist = True, color = "#f39c12",hist_kws=dict(alpha=0.8))
ax = sns.distplot(Participant_17['Percent'], label="All 17 tests", kde = False, hist = True, color = "#34495e", hist_kws=dict(alpha=0.8))
plt.legend(fontsize = 20)
plt.ylabel(ylabel = "No. of Participants", fontsize=25)
plt.xticks(fontsize = 15)
plt.yticks(fontsize = 15)
plt.xlabel(xlabel=  "Score %", fontsize=25)
fig.suptitle('Distribution of score (percentage) across participants in various categories', fontsize=20, x = 0.5, y = 0.95)
#plb.savefig('Score Percentage.png',dpi=100,bbox_inches='tight')

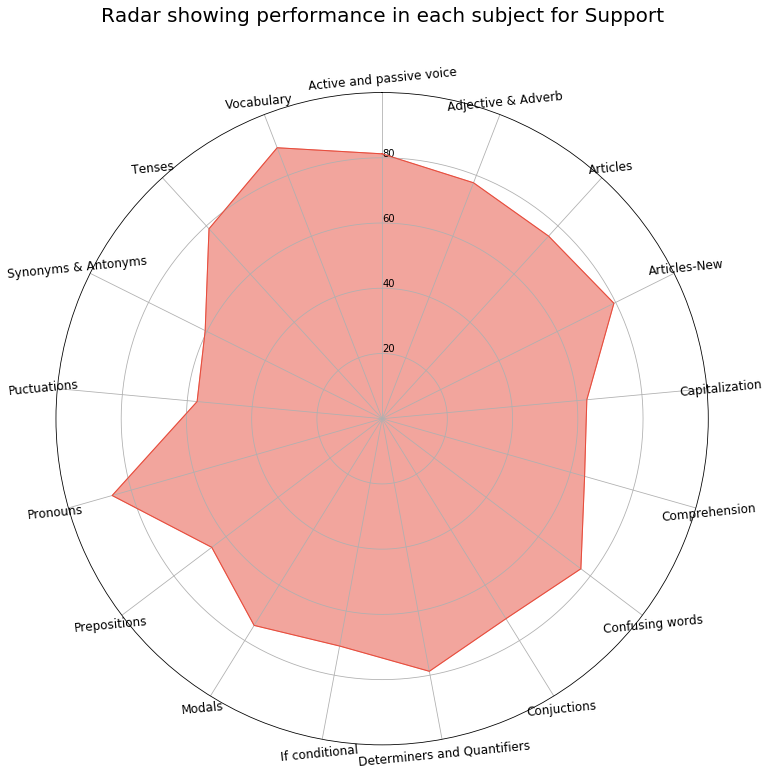
Radar Chart showing performance in each subject by Designation and Track
alltests = test_scores[test_scores['Participant identifier'].isin(list(Participant_17['Participant identifier']))]

alltests_Track = alltests.groupby(['Track','Test Name'])['Percent'].mean().reset_index() \
                .pivot(index = 'Track', columns = 'Test Name', values = 'Percent')
alltests_Designation = alltests.groupby(['Designation','Test Name'])['Percent'].mean().reset_index() \
                .pivot(index = 'Designation', columns = 'Test Name', values = 'Percent')

def make_spider(df, row, color, title):

    categories=list(df)[0:]
    N = len(categories)


    angles = [n / float(N) * 2 * pi for n in range(N)]
    angles += angles[:1]

    plt.rc('figure', figsize=(12, 12))

    ax = plt.subplot(1,1,1, polar=True)

    ax.set_theta_offset(pi / 2)
    ax.set_theta_direction(-1)


    plt.xticks(angles[:-1], categories, color='black', size=12)
    ax.tick_params(axis='x', rotation=5.5)

    ax.set_rlabel_position(0)
    plt.yticks([20,40,60,80], ["20","40","60","80"], color="black", size=10)
    plt.ylim(0,100)


    values=df.reset_index().loc[row].values.tolist()[1:]
    values += values[:1]
    ax.plot(angles, values, color = color, linewidth=1, linestyle='solid')
    ax.fill(angles, values, color = color, alpha = 0.5)


    title = "Radar showing performance in each subject for "+ title
    plt.title(title, fontsize=20, x = 0.5, y = 1.1)
 # Loop to plot
fills = ["#487eb0","#6a89cc", "#81cfe0","#00b5cc","#52b3d9"]
for row in range(0, len(alltests_Designation.index)):
    plt.figure()
    make_spider( row=row, df = alltests_Designation,title =alltests_Designation.index[row] , color = fills[row])
    name = alltests_Designation.index[row] + ".png"
    #plb.savefig(name,dpi=200,bbox_inches='tight')

fills = ["#f1c40f","#e67e22","#e74c3c"]
for row in range(0, len(alltests_Track.index)):
    plt.figure()
    make_spider( row=row, df = alltests_Track,title =alltests_Track.index[row] , color = fills[row])
    name = alltests_Track.index[row] + ".png"
    #plb.savefig(name,dpi=200,bbox_inches='tight')
By Designation -


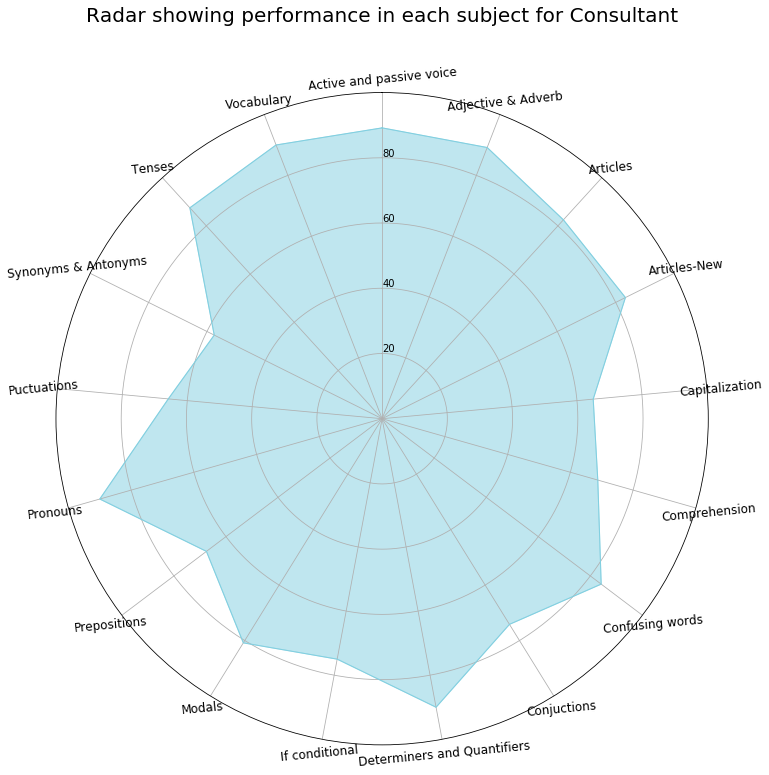

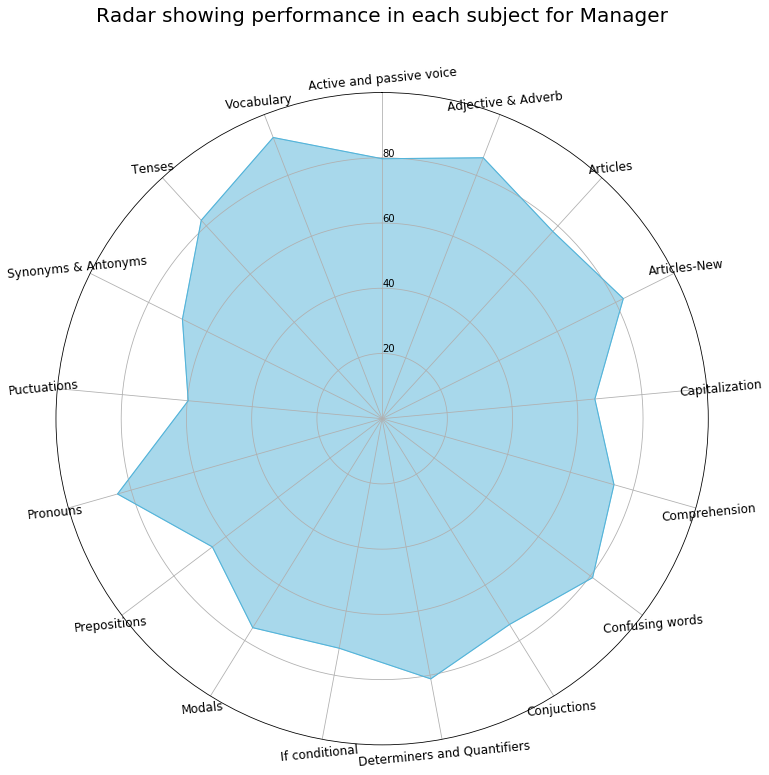
By Track -
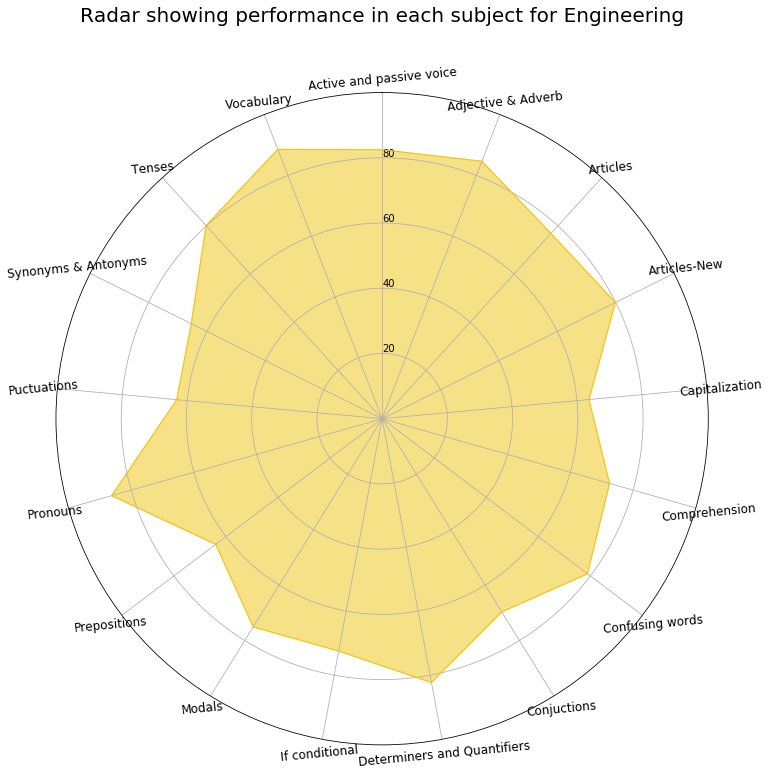
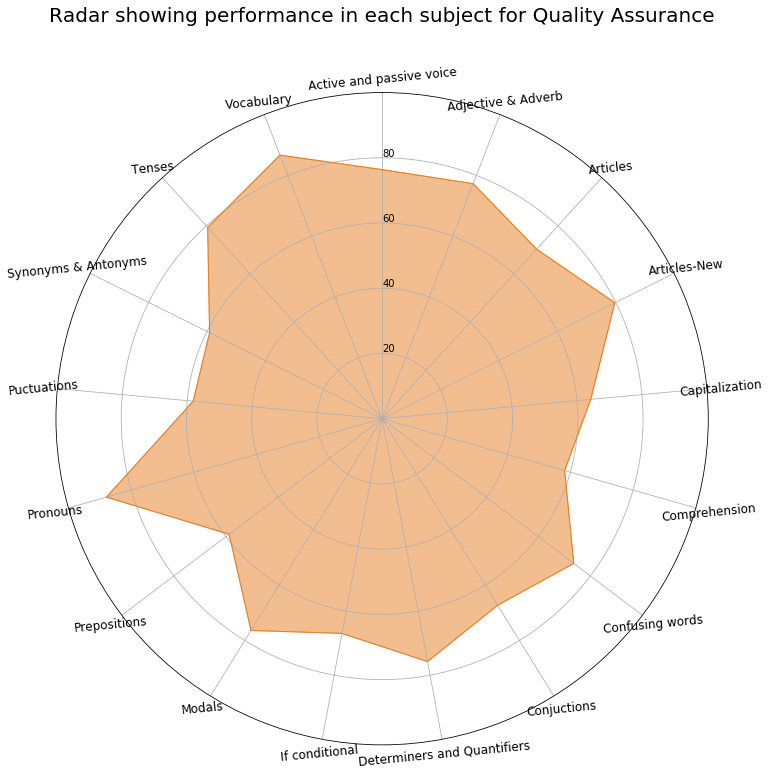
Score distribution of top 20 participants
participant = test_scores.groupby(['Participant identifier','Track','Designation']).agg({'Test Name':'size', 'Score':'sum',
                                                                               'maximum_score':'sum'}).reset_index()
participant['Percent'] =  round((participant['Score']/participant['maximum_score'])*100,2)
fig = plt.figure(figsize=(14,10))
toppers =participant.sort_values('Score', ascending = False).head(20).sort_values('Score')
my_range=range(0,len(toppers))

plt.hlines(y=toppers['Participant identifier'], xmin=0, xmax=toppers['Score'], color='black')
plt.plot(toppers['Score'], my_range, "o", color = 'black')
plt.xlabel('Score', fontsize=20)
plt.ylabel('Participants',fontsize=20)
plt.yticks(fontsize=15)
plt.xticks(fontsize=15)
plt.xlim(300,500)
plt.grid()
plt.title("Score distribution of top 20 participants", fontsize=20, x=0.5,y=1.02)
#plb.savefig('Lollipop_Participants',dpi=100,bbox_inches='tight')

Jupyter Notebook Link - Part 5 - Plotting Using Seaborn - Radar